insightsR - automated insights for tabular data
About
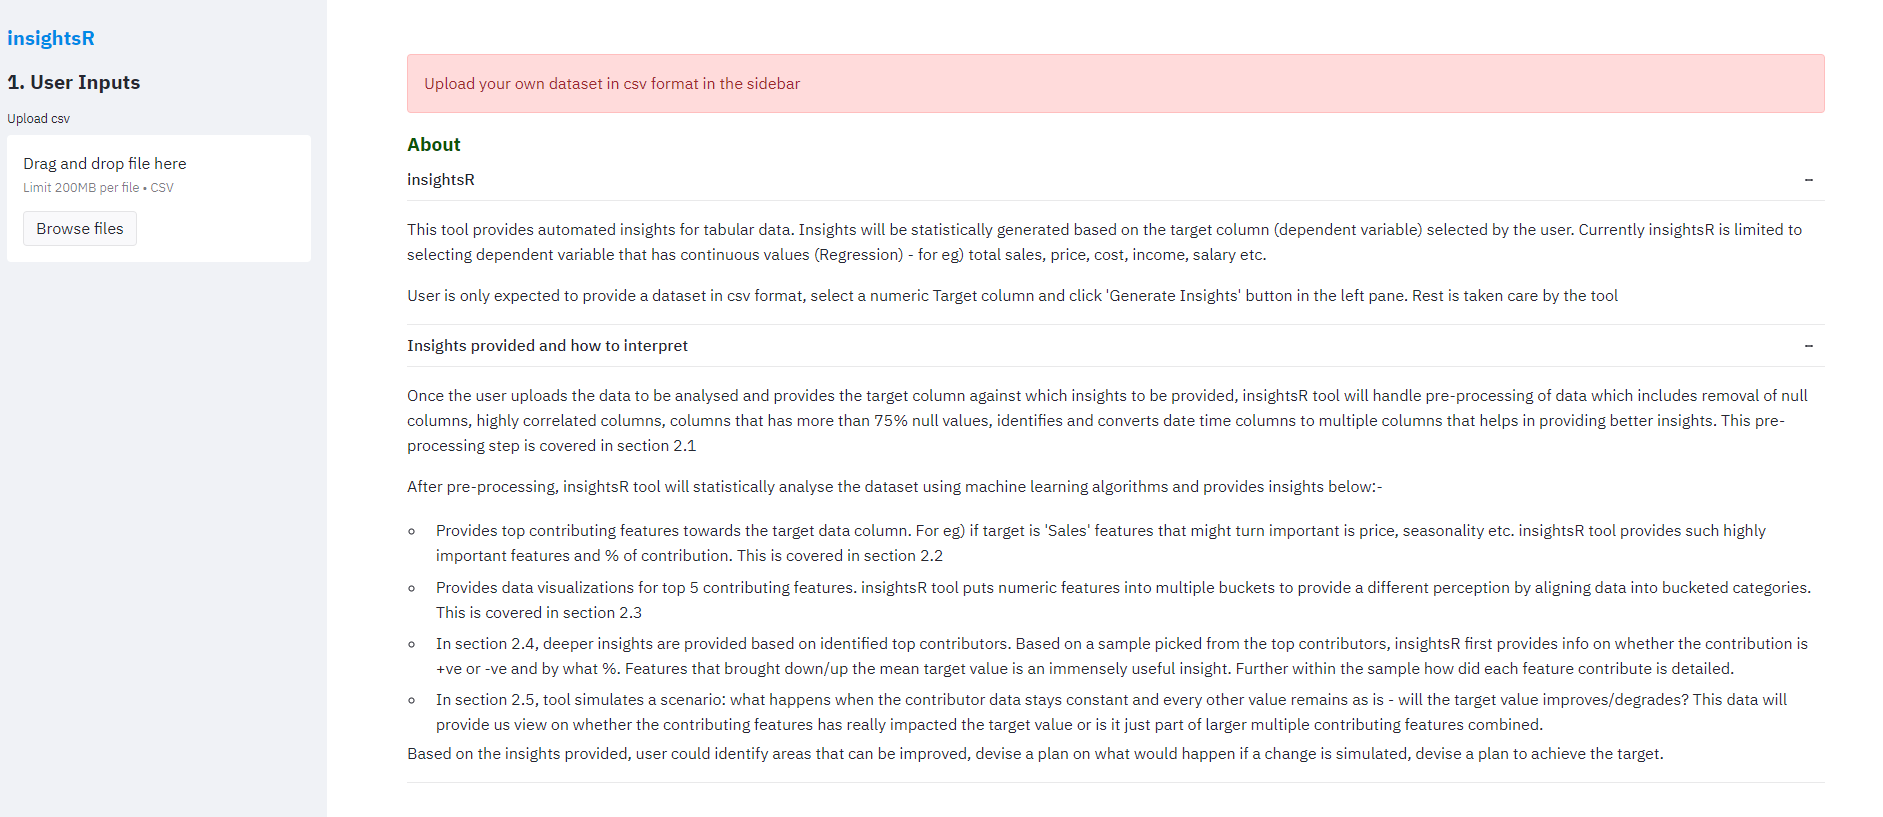
insightsR is an open source web application that tool provides automated insights from tabular data. Insights will be statistically generated based on the target column (dependant variable) selected by the user. Currently insightsR is limited to selecting dependant variable that has continuous values (Regression) - for eg) total sales, price, cost, income, salary etc. Continuous variable can take any values..
User is only expected to provide a dataset in csv format, select a numeric Target column and click ‘Generate Insights’ button in the left pane. Rest is taken care by the tool.
Installation
$git clone https://github.com/Vinothsuku/insightsR.git
$cd .\insightsr
$pip install -r requirements.txt
$streamlit run insightsr.py
insightsR is available online link
Github link
Insights provided and how to interpret
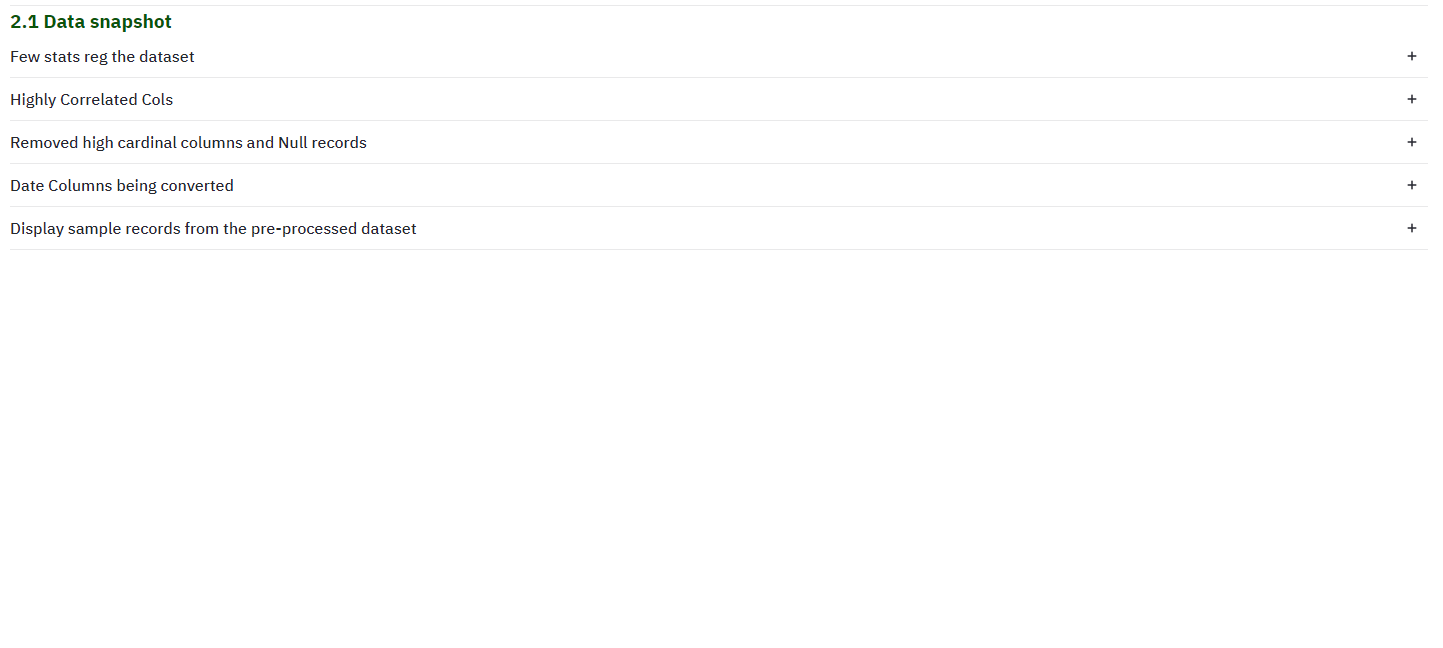
Once the user uploads the data to be analysed and provides the target column against which insights to be provided, insightsR tool will handle pre-processing of data which includes removal of null columns, highly correlated columns, columns that has more than 75% null values, identifies and converts date time columns to multiple columns like year, week, day of week etc that helps in providing better insights. This pre-processing step is covered in section 2.1
After pre-processing, insightsR tool will statistically analyse the dataset using machine learning algorithms and provides insights below:-
-
Top contributors: Provides top contributing features towards the target data column. For eg) if target is ‘Sales’ features that might turn important is price, seasonality etc. insightsR tool provides such highly important features and % of contribution. This is covered in section 2.2
-
Data visualizations: Provides data visualizations for top 5 contributing features. insightsR tool puts numeric features into multiple buckets to provide a different perception by aligning data into bucketed categories. This is covered in section 2.3
-
Feature contributions to the target: In section 2.4, deeper insights are provided based on identified top contributors. Based on a sample picked from the top contributors, insightsR first provides info on whether the contribution is +ve or -ve and by what %. Features that brought down/up the mean target value is an immensely useful insight. Further within the sample how did each feature contribute is detailed.
-
Data Simulation: In section 2.5, tool simulates a scenario: what happens when the contributor data stays constant and every other value remains as is - will the target value improves/degrades? This data will provide us view on whether the contributing features has really impacted the target value or is it just part of larger multiple contributing features combined.
Based on the analysis, user could identify areas that can be improved, devise a plan on what would happen if a change is simulated, devise a plan to achieve the target.
Let us explore with a sample dataset picked from link
California Housing dataset have following data: longitute, latitude, housing_median_age (median age of the house), total_rooms, total_bedrooms, population (total number of people residing within a block), households (total number of households, group of people residing within a home unit), median_income, median_house_value and ocean_proximity (location of house with respect to ocean).
Let us explore what factors contribute to median_house_value and related analytics.
2.2
Top Contributors
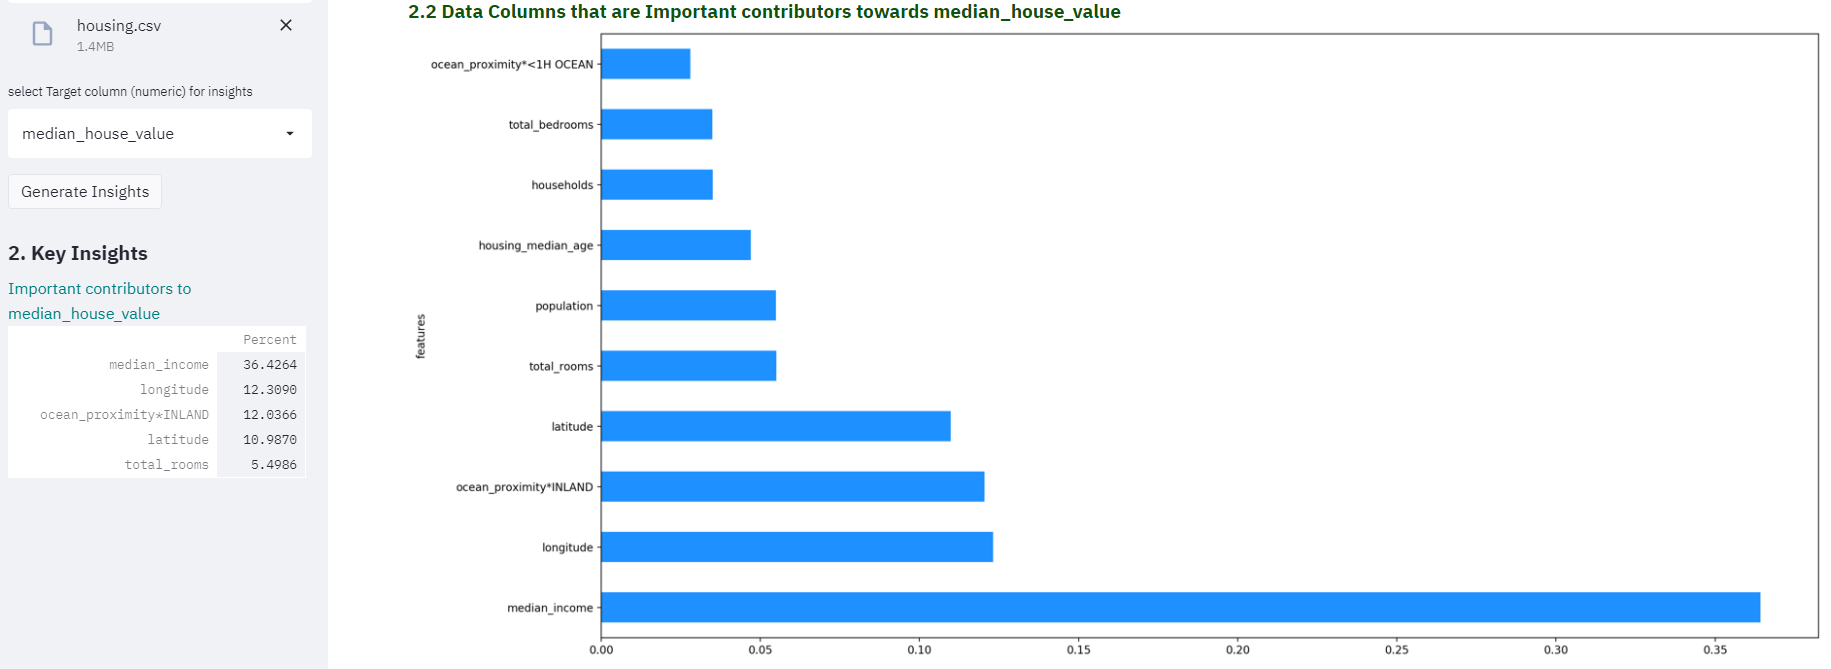
After processing the data statistically through machine learning models, we get top contributors that are influenzing the target variable. In this case, its the median_house_value
2.3
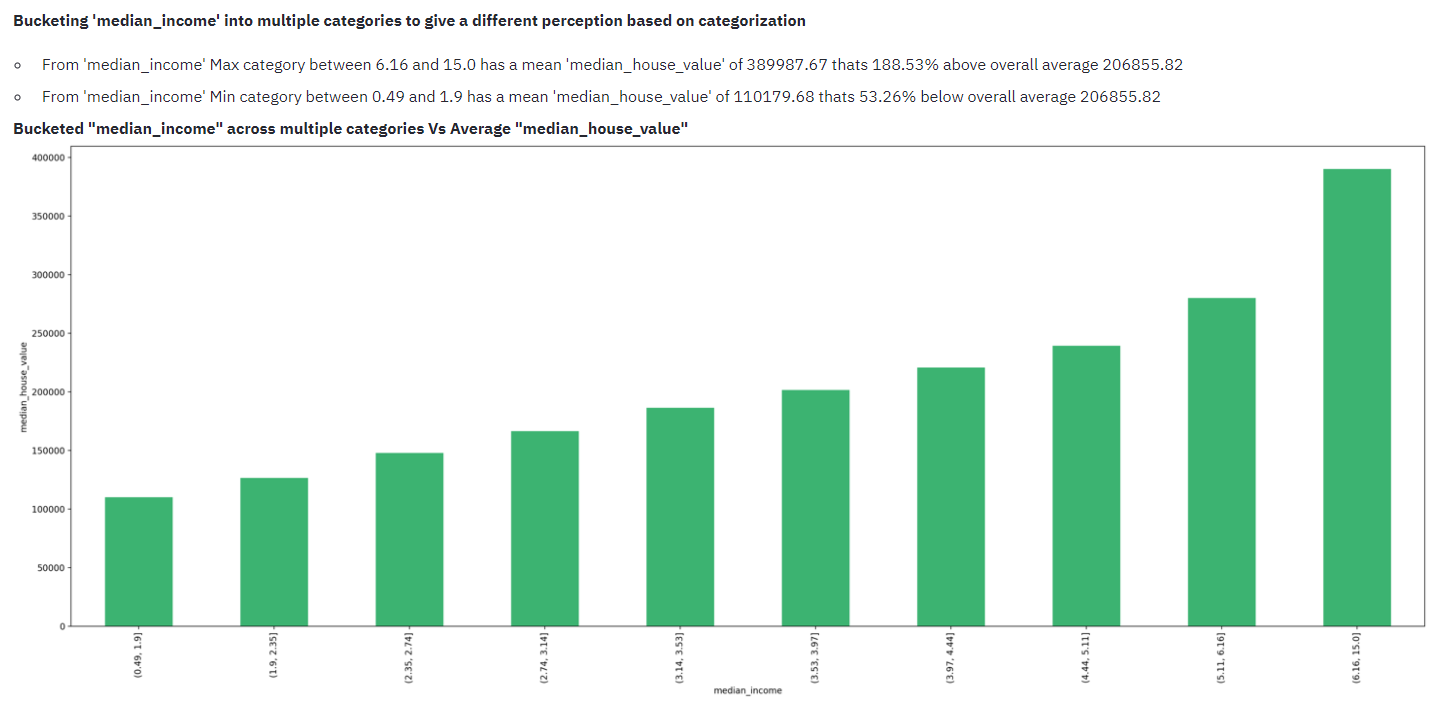
Data Visualizations
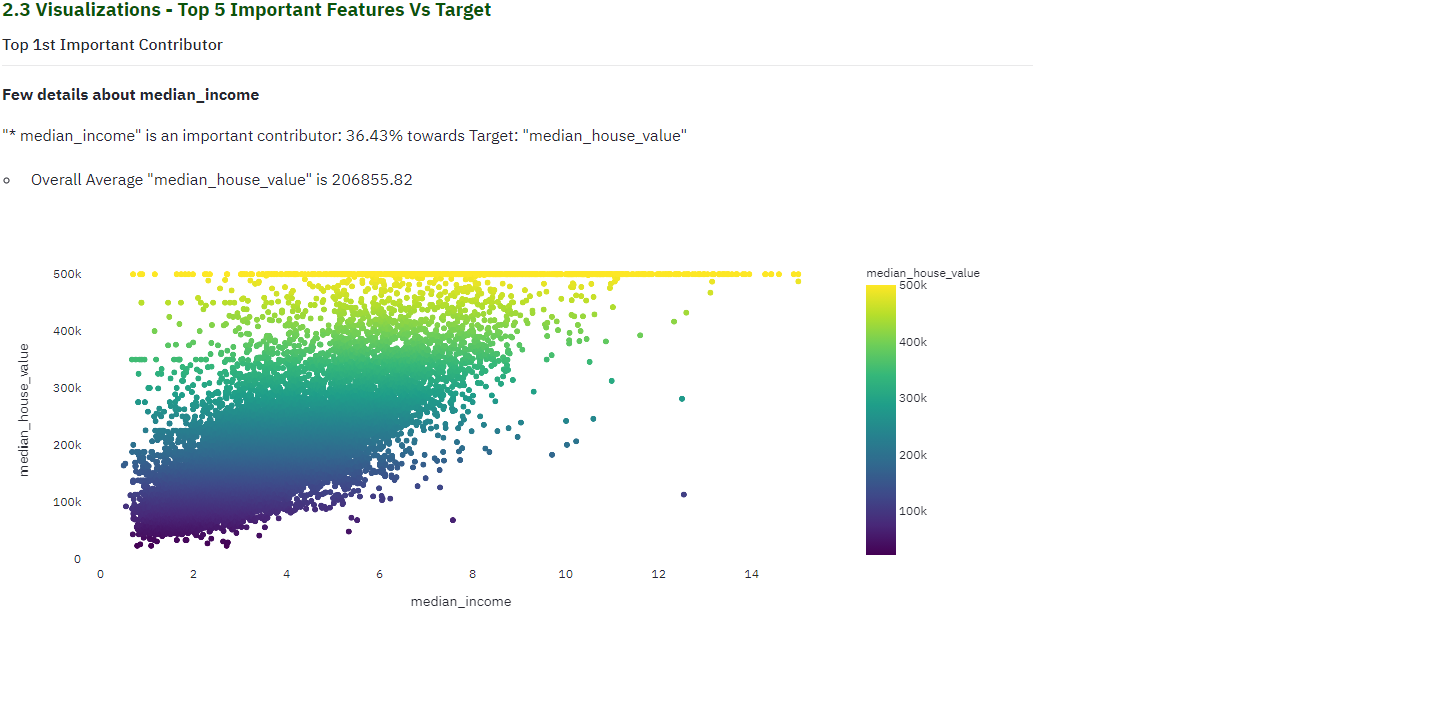
For each of top contributing factors, lets explore the data visually against the target. Tool automatically displays the data as a scatter/bar based on values. Incase of numeric values, tool automatically buckets data into multiple categories to give an understanding on different ranges and its values against the target.
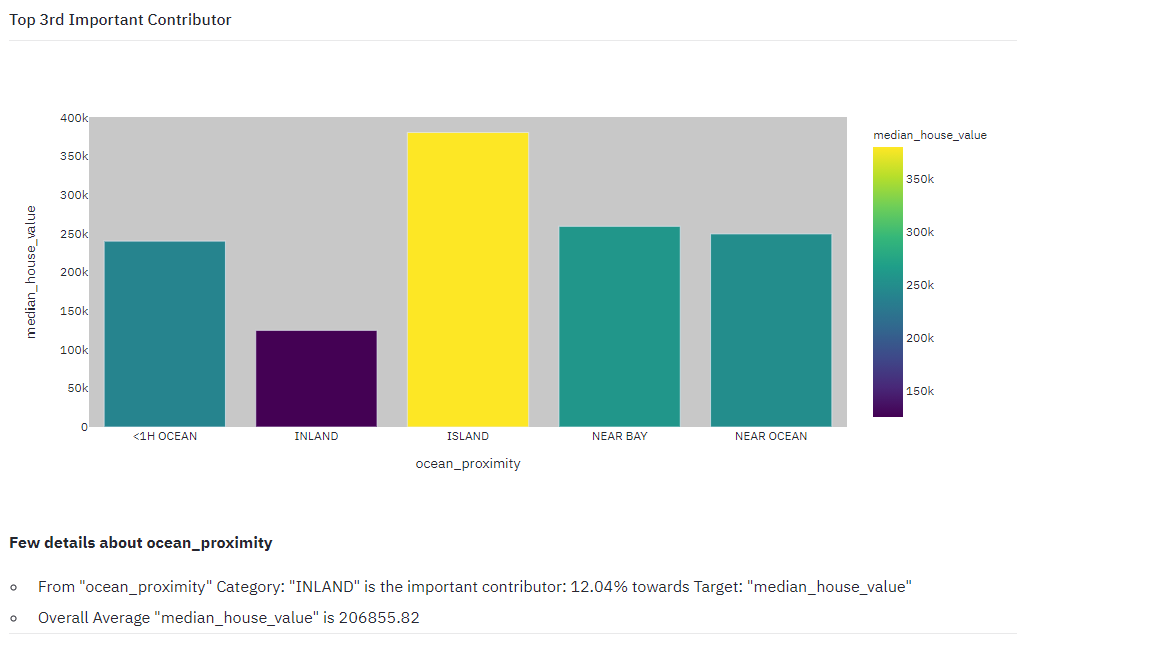
In this case below, though ISLAND category has larger median_house_value, the tool has determined that INLAND category is most influencing in determining the target value. Though ocean_proximity is a single data column, tool automatically picks each category within ocean_proximity to give the user, which categories within the parent is important than the other w.r.t target
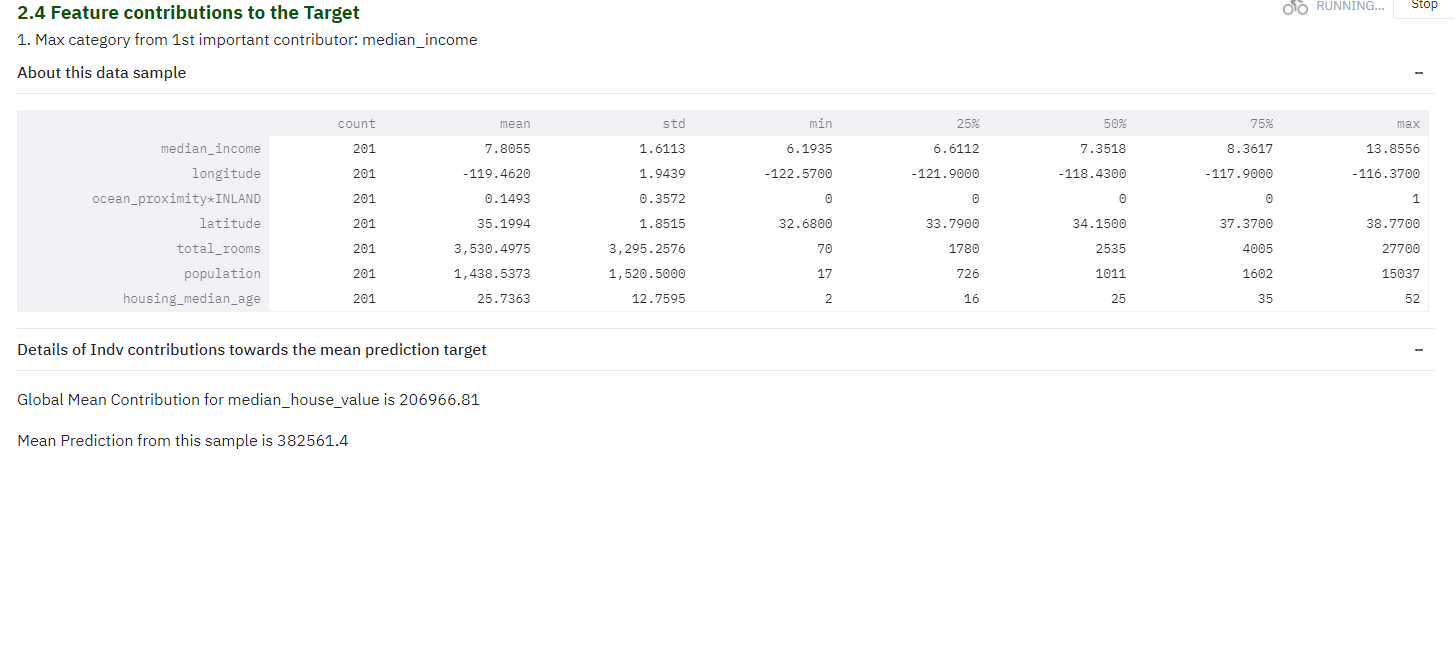
2.4
Feature Contributions to the target
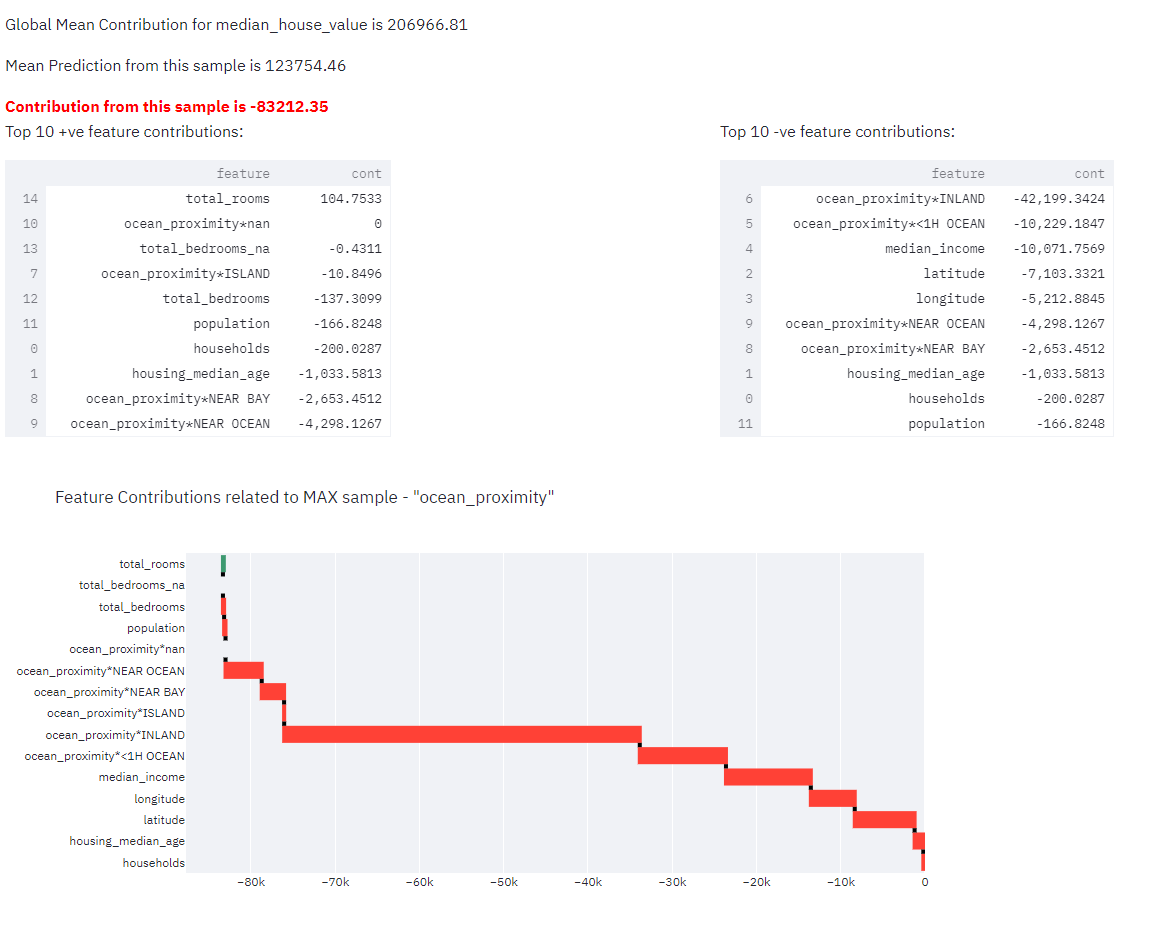
In this section, tool picks top contributors, picks a data sample and provides much needed info like contribution direction - positive/negative impact. How each feature within the sample is impacted is detailed in the waterfall chart.
Here - Mean contribution to the target is ~207k, whereas this particular sample’s prediction is ~382k. Contribution from this particular sample alone is ~175k. That means this sample has added ~175k positively impacting the median_house_value. With data values closer to this sample, mean house price will be exceeded by ~175k.
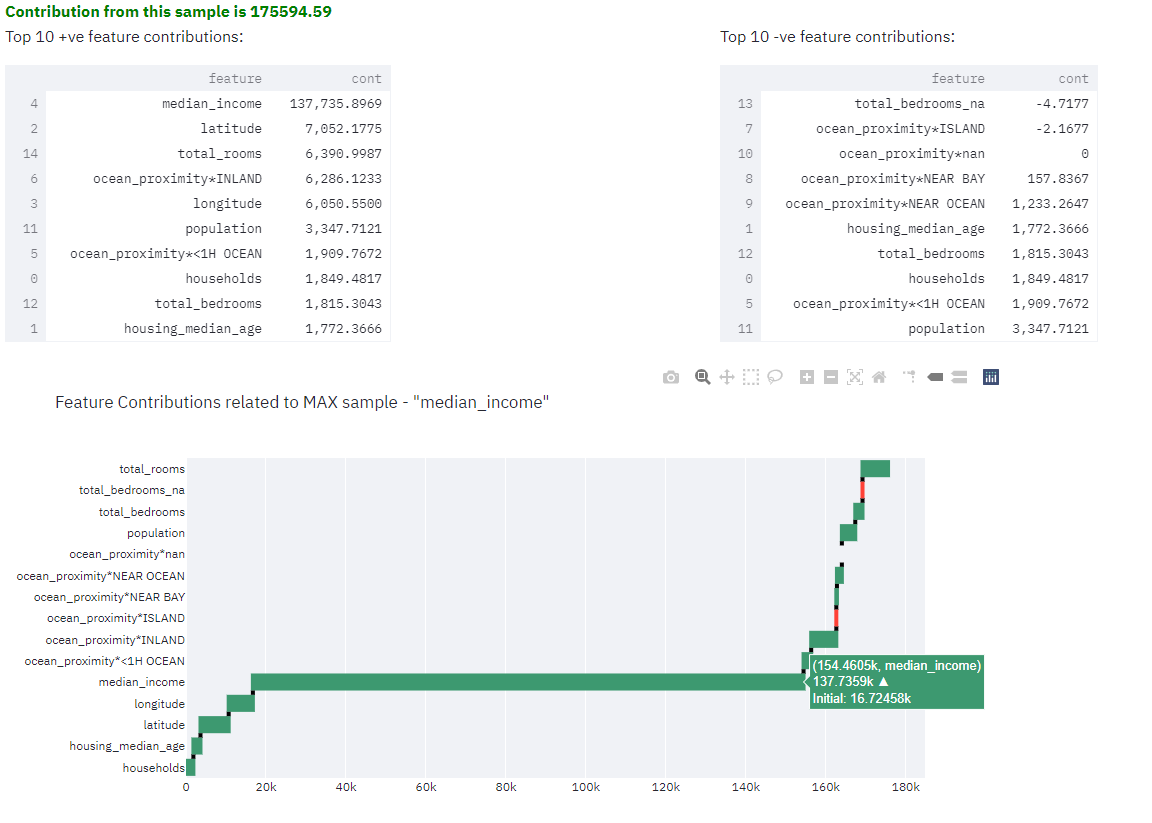
In this case, INLAND category within ocean_proximity has negatively impacted the median_house_price. Values within this sample has brought down median house price from 207k to 123k. Such insights are immensely useful.
2.5
Data Simulation
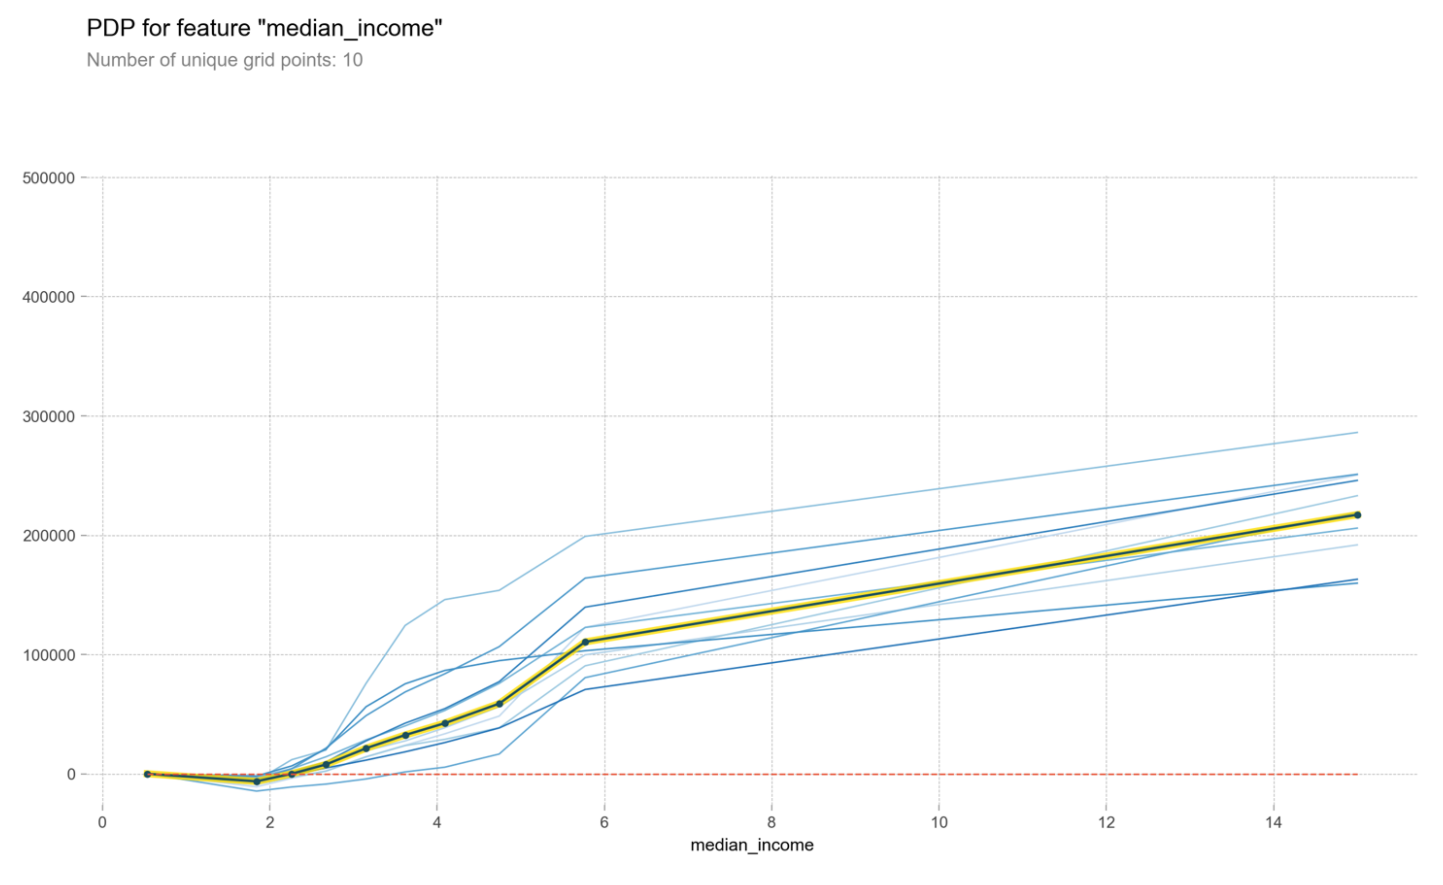
what happens when the contributor data stays the same for all rows and every other column remains as is - will the target value improves/degrades? This data will provide us view on whether the contributing features has really impacted the target value or is it just part of larger multiple contributing features combined.
In this case below median_income is highly positively impacting the median_house_price, which is evident in the graph.
Credits
- I learned a lot from fast.ai and it is always been my goto. Top-Down teaching approach has benefitted a lot of students across the world including myself. This tool is largely based on Machine Learning course taught by Jeremy Howard.
- Learnings from Kaggle